Cloud services are getting more and more mature. Before it was only a buzz but now everyone wants to get on the train. Flexibility, availability, pricing. So you are thinking about moving that database, datawarehouse or cubes to the cloud? On the Azure pricing list you can clearly see the number of CPU’s, memory, storage etc. What about the underlying disk system? This can be a rather important factor to look up if you have disk intensive ETL (Extract Transform Load) processes or other disk intensive tasks that you intend to move to Azure. How is Azure IO Performance? What is the difference between tiers, A, D and G series? I got a little bit curious and did some quick tests with HDtune on the following virtual machine configurations:
- Basic Tier, A2 (2 cores, 3,5gb ram, North Europe)
- Standard Tier, A2 (2 cores, 3,5gb ram, Central US)
- Standard Tier, D2 (2 cores, 7gb ram, Central US)
- Standard Tier, G2 (4 cores, 56gb ram, East US 2)
All are virtual machines (VM’s) with Windows 2012 R2 DataCenter default image. Please note that there are heaps of configurations and scenarios to consider for services in Azure. The intention of this post is not to be in anyhow any complete cover for that – just a quick test of disk performance in Azure VM’s.
Contents
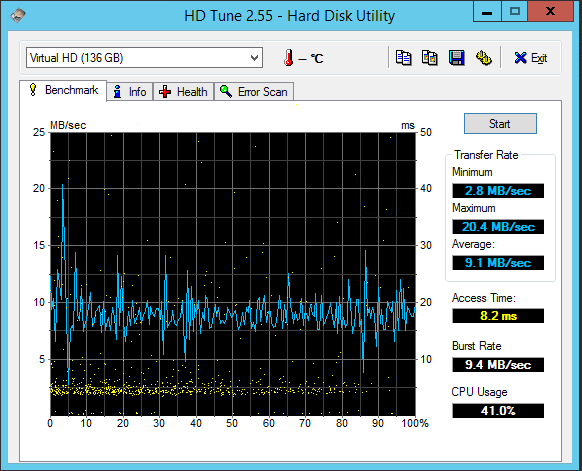
Basic Tier, A2 (2 cores, 3,5gb ram, North Europe)
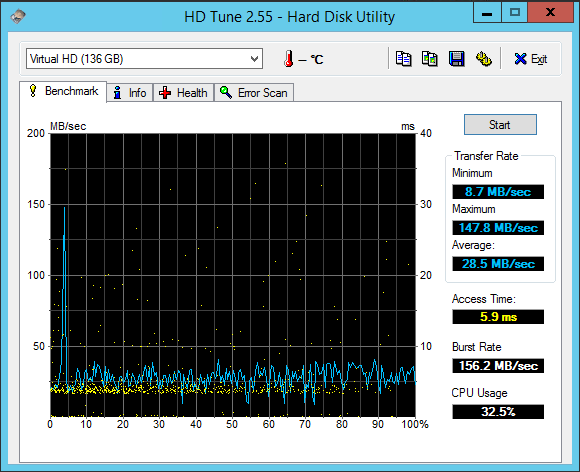
Standard Tier, A2 (2 cores, 3,5gb ram, Central US)
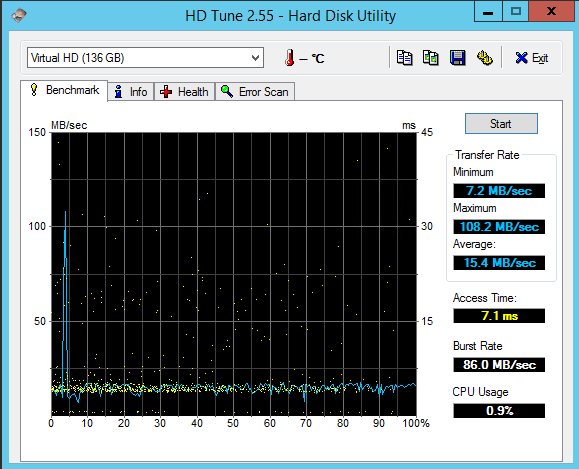
Standard Tier, D2 (2 cores, 7gb ram, Central US)
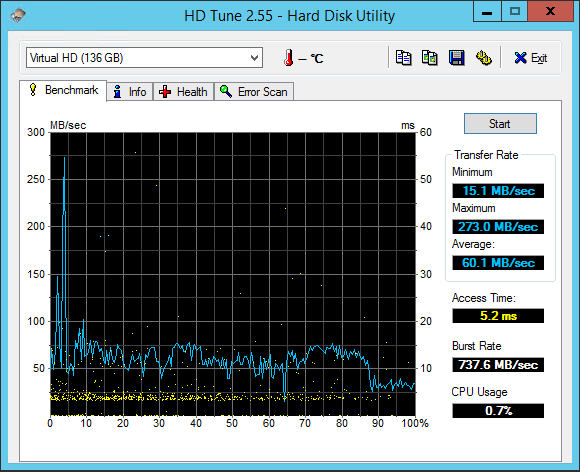
Standard Tier, G2 (4 cores, 56gb ram, East US 2)
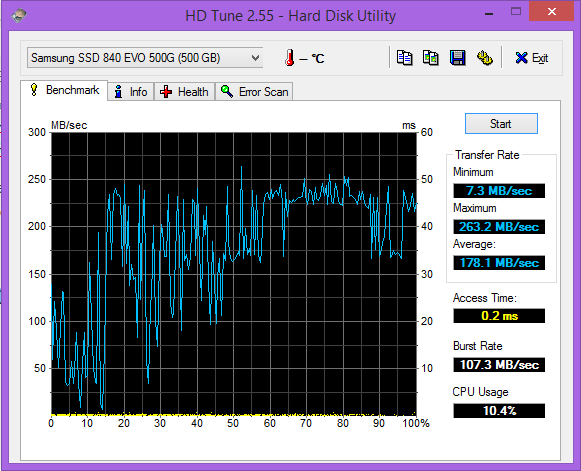
My laptop
For fun I will include my laptop, a Macbook Pro Core i5-3210m, 16gb, Samsung SSD 840 EVO 500 GB.
Conclusion
It seems as if my laptop still outperform most of the Azure VM options. However cloud services are constantly improving so there is probably likely to see faster alternatives in the near future. Also note that the test might not be completely accurate since I only run the tests once on each VM. However concerning the services available it’s important not only to look at the price and the more common specs like CPU, RAM, Disk Size etc. For more information on Azure subscription limits you may want to have a look here:
https://azure.microsoft.com/sv-se/documentation/articles/azure-subscription-service-limits/
Here you can see that the target IOPS for Azure is 300 for Basic Tier and 500 for Standard Tier:
| Max 8 KB IOPS per persistent disk (Basic Tier virtual machine) | 3002 |
| Max 8 KB IOPS per persistent disk (Standard Tier virtual machine) | 5002 |
| Total Request Rate (assuming 1KB object size) per storage account | Up to 20,000 IOPS, entities per second, or messages per second |
| Target Throughput for Single Blob | Up to 60 MB per second, or up to 500 requests per second |
| Target Throughput for Single Queue (1 KB messages) | Up to 2000 messages per second |
| Target Throughput for Single Table Partition (1 KB entities) | Up to 2000 entities per second |
| Target Throughput for Single File Share (Preview) | Up to 60 MB per second |
You may also configure multiple disks and stripe them in order to to improve performance as described here:
For data warehouse solutions the recent launched service for SQL Data Warehous “elastic data warehouse-as-a-service” might be of interest:
http://azure.microsoft.com/en-us/services/sql-data-warehouse/
Are you measuring d2 and g2 ok? D vms have local SSDs which are not networked, they should have much better performance than A2, at least I saw a big difference between the SSD mount in the D machines compared to the other, storage based mount.